

All Global Research articles can be read in 51 languages by activating the “Translate Website” drop down menu on the top banner of our home page (Desktop version).
***
Abstract
The world’s electric power system continues to be a principal source of carbon emissions, comparable to transport and such industries as steel and cement. Intense debate surrounds the issue of the pace at which it is greening. In this paper we offer a precise definition of greening as a rising proportion of electric power sourced from water, wind and sun (WWS), since these are all fundamentally renewable. Using the latest data from the BP Energy Review as well as national and regional sources, we demonstrate that by 2019 the EU-28 had reached a proportion of electricity generated from WWS of 34%, followed by China at 27%, Japan at 19% and the US at 17%. Moreover, the EU-28 achieved the fastest pace of transition, increasing its WWS-share of electricity generated from 20% in 2010 to 34% in 2019, or a 14% green shift in a decade. Over the same period, China’s green shift in power generation was 10%, while that of Japan was 9% (all achieved in the decade following the Fukushima disaster) and the US at an 7% shift. The IEA has just issued a report revealing that globally renewable sources of energy account for 29% of electricity generated in 2020, up 2% on 2019 levels.
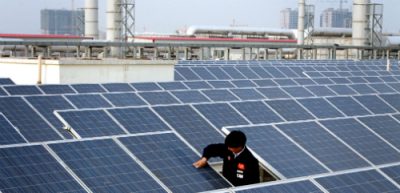
In this paper we examine the performance of China in greatest detail, since it is now the world’s largest burner of coal, operates the world’s largest electric power system, and is responsible for the highest levels of carbon emissions. We make the case that China has overall goals of decarbonization and dematerialization (i.e. using less material per unit of GDP), where the former goal is met by the shift to renewable sources of energy and the latter by the shift towards urban mining and the circular economy. Based on newly published data from the China Energy Council, we update our previous analyses of China’s energy choices, looking for the green shoots in an otherwise black energy system. China’s electric power system, now the largest in the world, continues to burn a lot of coal – nearly 4 billion tonnes in 2020, a 1% decrease on the 2019 total. But within this black power economy the green shoots are increasingly significant. We show that the proportion of China’s electric power generation sourced from water, wind and sun (WWS) by 2020 reached 27%, up from 17% a decade earlier – a 10% green shift in a decade. In terms of generating capacity the figures for China are even more striking. In 2020 China’s generating capacity sourced from WWS reached 41%, up from 25% in 2011, or a 16% green shift in capacity in 10 years. At this rate of a 1.6% green shift in generating capacity per year, China’s electric power system would be more green than black by 2026, with widespread repercussions, for China and the world. We put these data in their international comparative perspective, and in the perspective that China is electrifying its economy faster than any other major region. But the levels of carbon emissions continue to rise (reaching 13.5 billion tonnes carbon dioxide in 2020), with China’s leadership not predicting their peaking before 2030. So there is much to be done in terms of decarbonizing energy and electric power in particular. The wider significance of China’s green choices, in the context of its increasing assertiveness internationally, is discussed.
Introduction
The greening of the world’s major industries remains a matter of major concern, with attention focused on the sectors with the highest carbon emissions – electric power generation, transport (including shipping), and industrial sectors such as steel and cement. While the consumption of fossil fuels (coal in electric power generation, oil in transport and natural gas in industry) the absolute levels usually discussed conceal any underlying greening tendency in terms of an accelerating shift towards renewable sources. In this paper we offer a definition of greening of the electric power sector in terms of rising proportion of electric power sourced from water, wind and sun (WWS) – both in terms of electric power capacity and in terms of electricity generated. We focus on the level of electric power sourced from WWS, and the pace of the green shift, in terms of the total proportional shift over the past 10 years. Our interest is mainly focused on China, because it now has the largest electric power system in the world, and continues to burn the largest quantity of coal and emit the largest quantities of carbon (greenhouse gases). In this context, we wish to know whether the greening of China’s electric power system outweighs its blackening, and the pace at which this green shift is occurring.
First we examine the share of renewables (WWS) in total electric power generation, placing the EU-28, China, Japan and the US in comparative perspective. The data up to 2019 from the BP Statistical Review are given in Fig. 1, which we have prepared based on the data available.
Figure 1. Share of renewables in total electric power generation, by region, 2000-2019
Data: BP Energy Review
The global picture is dominated by the EU-28, which over the past 10 years has raised the proportion of electricity generated from WWS from 20% to very nearly 34% — or a 14% green shift in 10 years. The EU is followed by China, which reached 27% by 2019 (up from 17% in 2011, or a 10% green shift in the past decade). Then follows Japan which reached 19% by 2019 (a 9% shift), and the US at 17% (up from 10% a decade ago, a 7% shift).
At a global level, the International Energy Agency (IEA) has now just released its 2020 Global Energy Review, where electric power trends over the past 10 years are examined from the perspective of rising proportions of electric power from renewables and falling proportions from coal – as shown in our Fig. 2.1This is (we believe) the first time that the IEA has charted electric power trends in this way, clarifying the proportional rise in power sourced from renewables.
Figure 2. Global electric power generation, 2010 to 2020
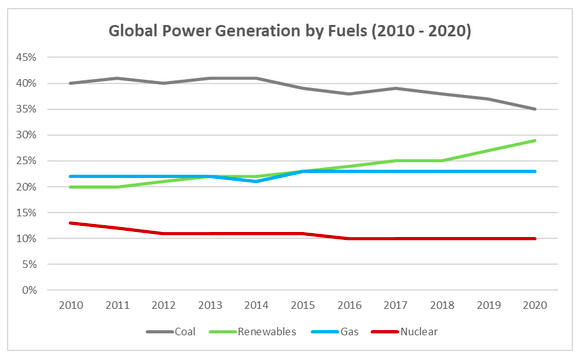
Source: Authors, based on IEA Global Energy Review 2020
To summarise: In terms of our definition of greening, the world has witnessed an increase in electricity generation sourced from water, wind and sun reaching 29% by 2020, up from 20% a decade earlier (according to the IEA). The EU has reached the highest proportion of power sourced from WWS, and it is greening fastest – a 14% green shift in power generated in 10 years. China follows the EU at 27% of its power sourced from WWS, and with the greening proceeding at a rate of 10% green shift in the last 10 years, then Japan at a green shift of 9% and the US at 7%. The IEA source indicates that Chinese carbon emissions in 2020 (post-pandemic) exceed levels for 2019.
Regional shares
The EU overtook China to become the world’s greenest electric power system in 2009, and accelerated its transition, greening in the past decade from 20% electricity sourced from WWS to close to 34% — a 14% green shift in power generated in 10 years. At this rate it will take the EU another 20 years to raise its proportion of green power to 50% — a tipping point of enormous significance.
Japan too has been increasing the proportion of electricity sourced from WWS from 10% in 2010 to 19% by 2019 – or a 9% green shift in the past 10 years. This was accelerated by the shift away from nuclear power triggered by the Fukushima nuclear disaster on March 11, 2011; prior to Fukushima, there had been no increase in the proportion of electricity sourced from WWS in Japan for the previous decade. In 2019, Japan’s electric power generation reached 1.036 trillion kWh (1,036 TWh). Of this, thermal sources accounted for 71% (NG 35%, coal 32%, oil 4%), renewable (WWS) for 19%, and nuclear for 6%.
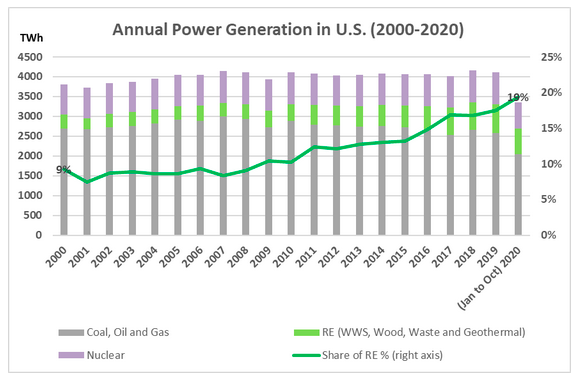
In the US thermal power generation has remained dominant, with nuclear also continuing to make a major contribution to GHG reduction. In the US, as shown in Figs. 3a and 3b, thermal (coal-fired) electricity generation dropped below that of nuclear power in 2020, giving the US a fresh aspect of decarbonization. NG remains the principal source of electricity, giving the following breakdown for the US.
Fig. 3a. Power Generation in the US, 2000 to 2020

Data source: EIA
Figure 3b. US net electricity generation by source, 1990 to 2020

Fig. 3a reveals that the US power generation system has reached a relatively stable level of 4,000 TWh over the past decade (compared with 7600 TWh in China – nearly double the US level), with the share of electricity generated from WWS sources reaching 19% by 2020 – compared with 27% for the case of China and 34% for the EU. In the US the share of electricity produced from thermal sources was around 63%, from nuclear sources 20% and the balance of 17% from WWS sources in 2019.2 Non-carbon sources of electricity in the US (nuclear + WWS) amount to 39%.
When we turn to China, we may view its performance in international comparative perspective. China has built an enormous power system to drive its expansion of manufacturing industry, now the largest in the world. Initially this was based largely on coal, with oil imports targeted at transport. China’s dependence on coal appears to have plateaued and is now falling slightly each year. Based on newly published data from the China Energy Council, in this article we update our previous analyses of China’s energy choices.3
Our fundamental chart (Fig. 4) reveals that China’s green shift in electric power generation has now lasted for 13 years of continuous change, since the year 2007. The newly updated chart reveals that in terms of electricity generated, the proportion of electricity generated from WWS sources has risen from 17% in 2011 to 27% in 2020, or a 10% green shift in 10 years. Over the 13-year span from 2007 to 2020, the green shift has been continuous, amounting to a green shift of 12% from WWS (up from 15% in 2007 to 27% in 2020).
The green shift in terms of electrical generating capacity is even more striking.4 In terms of generating capacity, China’s proportion of power capacity sourced from water, wind and sun (WWS) reached 41% in 2020, up from 20% in 2007 – or a 21% green shift in generating capacity over 13 years. This amounts to an average of 1.6% per year for the past 13 years. If continued at this rate (and all policy positions indicate that it will be) then China would reach a tipping point of 50% generating capacity sourced from WWS by 2026 at the latest.5 By that time China’s electric power system would be more green than black – a fundamental tipping point that would have ramifications throughout the economy.
Fig. 4. Greening of China’s electric power system, 1990 to 2020

Data source: CEC and NBS China
These are surprising results in themselves, considering that the Chinese electric power system is now the largest in the world. (China’s electric power generation in 2020 reached 7,623 TWh, compared with US total generation of 4,000 TWh.) What is even more remarkable is that these proportional green shifts have proven to be continuous over the last 13 years, overwhelming any reversion to coal-fired power particularly in recent years.
Nevertheless China’s carbon emissions continue to rise, indicating that the country’s decarbonization is not proceeding fast enough. China has clear energy goals of electrification of the economy and greening of its electric power system, combined with dematerialization in the sense that materials are increasingly sourced from circular flows (urban mining and recycling). The significance of these goals for China itself and for the world are now becoming clear to commentators, such as the international consultancy Wood Mackenzie.6
The detailed results for China’s power generation over the past 10 years are given in Table 1, updated to include results for 2020.
Table 1 China’s electric power sector, 2010 to 2020
1A. Installed Capacity (GW)

1B. Power Generation (TWh)

1C. Annual investment (CNY Billion)

Data Source: CEC and NBS
Table 1A reveals that China’s electric power system is still dominated by fossil fuels, particularly coal. In 2020 coal-fired power (thermal power) of 1,245 GW accounted for 57% of China’s electric capacity – but it has been decreasing at 1.5% per year and is unlikely to expand much in future. It can be expected to reach the 50% tipping point by 2025, and certainly before 2027. According to Yin Linlin, Director of the Power Fuel Division of CEC’s Department of Industrial Planning, Environment and Resources, while China is endeavouring to control the installed capacity of coal power below 1,250 GW, those of wind and solar will each exceed 400 GW by 2025, thus non-fossil energy installed capacity will account for nearly 50%.7 The total electric power generating system reached 2,200 GW (i.e. 2.2 TW) in 2020. In terms of new capacity added in 2020, coal-fired power (thermal power) accounted for 54 GW of new capacity, while hydro accounted for 14 GW, wind for 72 GW and solar for 48 GW – making an addition of 134 GW from WWS sources. So the new capacity added from WWS (green) sources at 134 GW was three times the capacity addition from thermal (black) sources.8 This is why we can say that the Chinese electric power system continues to green faster than it is blackening, and is doing so overwhelmingly from WWS sources.
Table 1 reveals that China has been expanding its reliance on nuclear power in the generation of electric power. In terms of electricity generated, nuclear power has increased from 75 TWh in 2010 to 366 TWh in 2020, or a fivefold increase over the decade. In terms of capacity addition, nuclear was increased from 11 GW in 2010 to 50 GW in 2020, or an increase of 450% over the decade. But the Table also reveals that nuclear is significantly overshadowed by WWS (green) as proportion of electric power. In terms of electricity generated, nuclear rose from 2% of electricity generated in 2010 to 5% in 2020, while in terms of capacity it was even less significant, rising from 1% of electric capacity in 2010 to 2% in 2020. At these levels, China looks to emulate the US, Japan and the EU in terms of reliance on nuclear – but in a way that fails to keep up with the faster rising proportion of green electric power.
Fig. 5 shows how China’s total power system has doubled in terms of capacity over the past decade (expanding from 966 GW in 2010 to 2200 GW (2.2 TW) in 2020, while continuing its relentless greening.
Fig. 5. China’s Installed Power Capacity 2010 vs 2020

Data Source: CEC and NBS
Total electric capacity sourced from WWS reached 905 GW by 2020 – which means that it can be anticipated to reach the milestone of 1000 GW (or 1 terawatt (TW)) within the next year. China would be the first major industrial country to reach terawatt level for green sources of power (WWS). The time to reach the second terawatt of green power can be anticipated to be much shorter than the time needed to reach this first terawatt – such is the nature of cumulative exponential expansion. These green targets are reinforced by the statement from China’s president, Xi Jinping, in December 2020 of new Intended Nationally Determined Contributions (INDCs) to reaching global climate targets, where China announced that wind and solar generating capacity combined would reach 1,200 GW (1.2 TW) by 2030.9 The data presented above would indicate that this fresh target is well within reach.
The data on investment provided in Table 1C replicate the same story of a continuous green shift. Investment in green sources of power reached RMB 431 billion in 2020 which at an exchange rate of 0.15 would translate to US$ 64.7 billion – allocated as RMB 108 bn for hydro, RMB 262 bn for wind and RMB 61 bn for solar. These totals far exceed the RMB 55 billion allocated to investment in thermal (coal-fired) sources – which translates to US$ 8.3 billion. The fact that investment in green sources in 2020 was about eight times investment in black sources (US$ 64.7 billion for green sources as compared with just $8.3 billion for black) is another strong indicator of the continuing green trend. The investment data also reveal a falling reliance on nuclear power, with investment falling from 16% of total investment in 2010 down to 12% in 2020.
Fig. 6 shows the rise in annual generating capacity increases over the past 30 years, and the relentless rise of capacity growth from WWS sources. Since 2016, WWS sources have constituted over 50% of the annual capacity addition. In 2020, the proportion of electric capacity added in the year attributed to WWS sources reached 71%.
Fig. 6. China’s annual capacity additions, 1991-2020
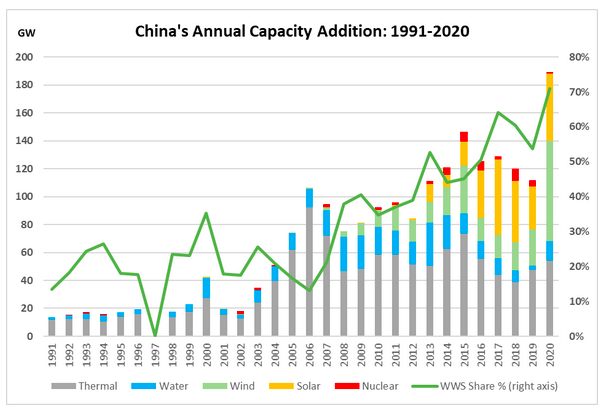
Data source: UN and CEC
Fig. 7 shows the electricity generated from all sources each year over the past 30 years, allowing for a comparison between electricity generated from thermal sources as compared with that generated from WWS sources, 1990 to 2020. Total electricity generated reached 7623 TWh (billion kWh) in 2020, with 5174 TWh coming from thermal sources and 2053 TWh coming from WWS sources. The RHS reveals that this generation of power from WWS sources now accounts for 27% of total electricity generated. This reveals what a huge struggle it has been for green power to overhaul black power in a colossal system experiencing rapid expansion like the Chinese.
Fig. 7. Annual power generation in China, 1990 to 2020
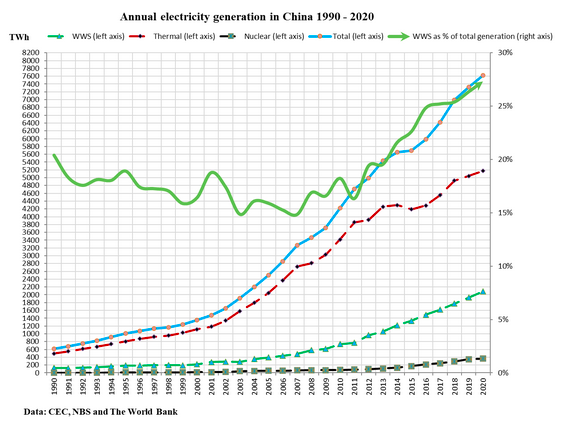
Data sources: CEC, NBS, World Bank
Next, fig. 8 on the coal-fired power system reveals just how enormous it continues to be. The coal-fired plants generated 5,174 TWh power in 2020. However, the total coal consumption is estimated to have dropped 0.8% down to 3.9 billion tons based on the data from January to October 2020.10 According to the preliminary accounting of National Bureau of Statistics of China, the share of coal in the total energy consumption decreased 1% from 2019 to 56.7% in 2020.11
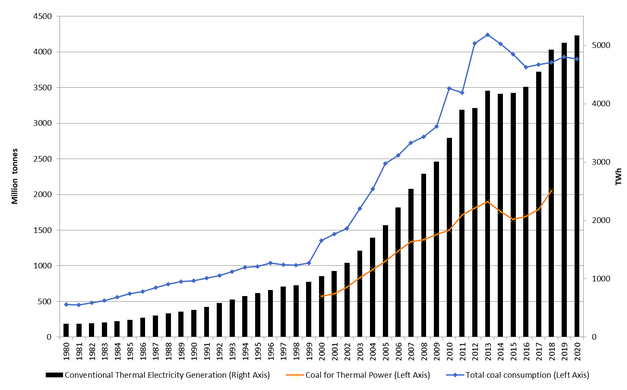
Data Source: CEC, NBS and BP Energy Review
A different angle on China’s greening of its electric power system is its imports of fossil fuels, measured in tonnes, as shown in Fig. 9. In 2020 China was the world’s largest importer of oil (used mostly in transport) with natural gas imports growing marginally each year over the past five years. Coal imports have remained stable at just over 300 million tonnes imported in 2020. We have consistently viewed the high level of dependence of China on fossil fuel imports as one of the principal drivers of its green shift in electric power generation. The rise in fossil fuel imports gives rise to pressure to produce energy in China from manufactured devices, such as wind turbines, solar cells and energy storage devices like batteries, all of which involve electrification and are under domestic control. This is one of the factors leading to the creation of a quite different energy paradigm in China, one that departs from dependence on fossil fuels and instead enhances reliance on electrification and manufacturing.
Fig. 9. China’s imports of fossil fuels, 2010 to 2020
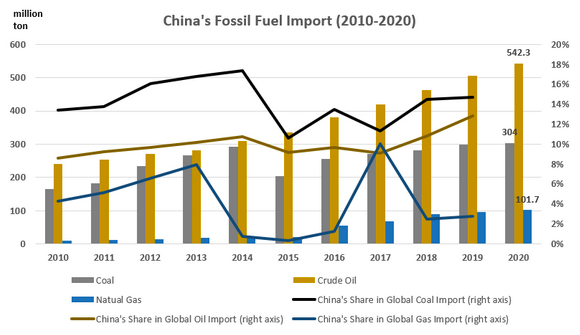
Data sources: UN and GACC
Carbon emissions
China’s greening of its electric power system has yet to be reflected in the data on its carbon emissions, which continue to rise, albeit in moderated fashion. Figure 10 on carbon emissions reveals the pattern over the past decade.
Figure 10. China and US: Emissions of carbon dioxide per year, 2010 to 2020
Data Source: Climate Action Tracker and World Bank
Emissions of carbon dioxide in billion tonnes per year (GtCO2/year) have increased from 10.9 GtCO2/year in 2010 to 13.5 GtCO2/year in 2020, revealing that China has yet to reach the critical turning point where carbon emissions start to decline. But the increases are falling, and this tipping point can be anticipated to be reached in the near future, and certainly earlier than the 2030 target specified by China’s leadership. During the same period, emissions of the US were in the range between 6.5 and 7 GtCO2/year. In terms of per capita emissions, China had figures just below 10 tons (8.2 tons in 2010 and 9.6 tons in 2020), which were less than 50% of the US levels throughout the decade.
Electrification
Finally we put these China data on the greening of electric power in the setting that China leads the world in the pace of its electrification. As shown in Fig. 11, China has been expanding its electrical power system as a proportion of its total energy consumption, substituting electrical energy for direct combustion of fossil fuels (coal, oil, gas) in industry, transport, domestic use and other sectors as well. From a low base starting at around the year 2000 China has built its electrical power system to the point where it overtook the proportional electrified levels of the US and EU by around 2015 (reaching a proportion of 16%) and ultimately caught up with Japan by 2019 (reaching an electrification level of 18.5%) by the beginning of the 2020s. China now stands first in the proportion of its energy consumption supplied by electrical power. It is thus most open to greening through the contribution of power sourced from water, wind and sun. But the question remains: which part of the world is moving most rapidly in this greening direction?12
Figure 11. Share of electricity in total energy consumption, China, EU, US, Japan, 2000-2019
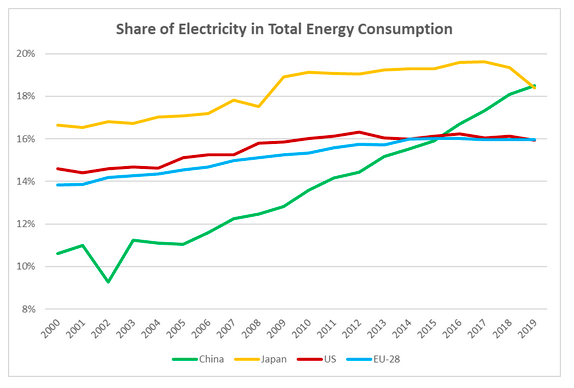
Data: BP Energy Review
The geopolitics of materials needed for the green shift in electric power
The International Energy Agency (IEA) has recently turned its attention towards the role of “critical raw materials” (CRMs) as the world economy gears up to an unprecedented green shift in 2021, after the pandemic year 2020. There are two issues involved. Firstly, there are raw materials needed for the operation of energy systems, where both thermal power systems and nuclear systems call for raw materials that have to be mined, and thereby set a limit to renewability – as contrasted with power generated based on water, wind and sun which are all continuously renewed. And secondly there are raw materials needed for the manufacture of green energy equipment (e.g. wind turbines, solar cells, batteries) as well as electrified transport (e.g. EVs and FCVs). It is the latter issue to which the IEA is drawing attention, promising a major review and report on the matter by May 2021.13 Of course of all the major regions China is least likely to be affected by these issues, given its dominance of supply of rare earths and other critical materials needed in manufacture of green technologies, and its progress in promoting recirculation of materials in high-tech industries, which is known in China as “urban mining”.14
The green shift and China’s rising international assertiveness
We cannot conclude this commentary on China’s green energy choices in comparative perspective without putting them in the context of the country’s increasing international assertiveness. China is now both seeking international leadership via its Belt and Road Initiative and its recent treaty with the EU even as it moves aggressively to enforce its territorial claims in the South China Sea. The steady expansion of its green power sector can be viewed as one element of its bid for international leadership which is threatened by its aggressive policies elsewhere.
Clearly it would be naïve to see China greening its energy system as an act of benevolence for the world community. Our argument is that China must be perceived as systematically proceeding to green its energy system because it views it as in its national interest to do so. More than other countries, China views a green energy system as one that reduces geopolitical tensions and enhances its energy security as well as drastically reducing carbon particulate pollution in its urban and industrial areas. It is therefore from China’s perspective worth pursuing as an end in itself. Pursuit of world leadership in greening is clearly recognized by China as one factor in achieving a strong position in building the industries that will dominate energy choices in the 21st century. It is also an aspect of the global economy where the US has abdicated leadership (especially under Trump). That China’s energy choices reduce global carbon emissions is a favorable by-product of China’s search for energy security and environmental clean-up.
Concluding remarks
The significance of the energy choices made by China lies in the fact that they reveal how China is inexorably swinging its economy behind greater and greater electrification, where the electric power system is being “fuelled” less and less proportionally by fossil fuels and more and more from renewable (WWS) sources. This decarbonization trend is complemented by a dematerialization trend where China increasingly sources its industrial materials from circular flows, i.e. urban mining and recycling. In this paper we are concerned to point to these trends, as green shoots of a green growth economy – without losing sight of the fact that China is still the world’s largest importer and user of fossil fuels and world’s largest consumer of industrial raw materials like iron ore, aluminium and copper. The significance of this for China is amplified by the fact that such sources are based on devices that are manufactured rather than on materials mined and drilled from the earth – on solar PV cells, wind turbines, batteries and their associated value chains and cost reductions based on associated learning curves. This is a trend that can be expected to continue.15 In the transport sector the same shift is leading to batteries and EVs and FCVs – all products of manufacturing, and all enjoying strong cost reductions associated with the learning curve. And within these segments themselves, solar PV cells are moving to new generations like eARC PV cells and wind turbines from onshore wind power to offshore wind power, where the turbines are mounted on platforms which also have to be manufactured. These newer generations of devices are all products of manufacturing and innovation, where China plays a key role as a leading patenter of new energy technologies. What is involved is a revolution in the energy system, from one based on extraction of fossil fuels (with their environmental and geopolitical hazards), to one based on manufacturing, complemented by the circulation of materials via recycling and urban mining. Of course the specialized material requirements of these green technological shifts are also significant, in terms of rare earths and other industrial materials like copper – where China’s innovations in the circular flow economy are helping to redress the balance.
The leadership of the EU in engineering a green shift in power generation, as demonstrated in this paper, shows how the opportunities are there for leading industrialized countries to stay one step ahead of China in terms of innovation and market capture. Commentaries such as the recent Wood Mackenzie report, Tectonic Shift (cited above) tend to regard China’s lead in low-carbon technologies as unassailable – but the fact of EU leadership in the green shift in electric power indicates that this is not the case.
Commentary on China’s energy choices continues to emphasize how its coal consumption remains the largest in the world, its carbon emissions continue to be the largest, while its imports of oil (and gas) have now reached the largest in the world, though in per capita terms the US holds an enormous lead in both coal and oil consumption. Our argument is that such data, while real, miss the essential greening that has been in continuous operation now for the past 13 years. This article reveals that China has been experiencing a green shift in electric power capacity of 1.6% per year for the past 13 years, which if continued (as seems likely) will result in China’s electric generating capacity becoming more green than black (more than 50% from green, WWS sources) within six years, by 2027. This is the trend that dominates China’s energy choices, providing a level of energy security that would be quite impossible if China had continued to pursue a fossil fuel pathway.
Decarbonization and dematerialization (i.e. reducing material usage per unit GDP), meeting China’s twin goals of enhancing energy and material security, have the fortunate side effect of eventually lowering carbon emissions, which have now been made an official goal in the commitment to reach carbon neutrality by 2060. Such choices also resolve otherwise insoluble problems to do with rising geopolitical tensions as competition heats up for dwindling fossil fuel resources and with rising levels of carbon particulate pollution from burning of fossil fuels. China is leading the way in a dramatically effective solution for such problems through its green shift, meeting its own national interests before all else. The fact that its greening choices reduce carbon emissions worldwide is a favorable by-product of this increasingly assertive country’s energy choices.
*
Note to readers: please click the share buttons above or below. Forward this article to your email lists. Crosspost on your blog site, internet forums. etc.
John A. Mathews is Professor Emeritus in the Macquarie Business School, Macquarie University, Sydney.
Xin Huang is a research associate at Macquaire Business School, Macquaire University, Sydney, Australia.
Sources
Charles, R.G., Douglas, P., Dowling, M., Liversage, G. and Davies, M.L. 2020, Resources, Conservation & Recycling, 161 (104923)
DeWit, A. 2020. Decarbonization and Critical Raw Materials: Some Issues for Japan, Asia Pacific Journal: Japan Focus, Vol 19, issue 3, article 2, at: Decarbonization and Critical Raw Materials: Some Issues for Japan | The Asia-Pacific Journal: Japan Focus (apjjf.org)
Mathews, J.A. and Huang, C.X 2020. Greening trends within China’s energy system: A 2019 update, Asia Pacific Journal: Japan Focus, Vol 18, issue 17, article 3
Mathews, J.A. and Tan, H. 2014. Manufacture renewables to build energy security, Nature, (11 Sep 2014)
Mathews, J.A. and Tan, H. 2016. Circular economy: Lessons from China, Nature, (23 March 2016), at: Circular economy: Lessons from China : Nature News & Comment
Notes
1 See IEA, Global Energy Review: CO2 emissions in 2020, at: Global Energy Review: CO2 Emissions in 2020 – Analysis – IEA
2 See the EIA Q&A, at: Frequently Asked Questions (FAQs) – U.S. Energy Information Administration (EIA)
3 See the updated CEC data.
4 The reason that the green shift is less pronounced in electricity generation is that the levels of generating efficiency vary across solar, wind and hydro sources.
5 Calculated as a further six years at a shift of 1.6% per year – or a 9.6% shift in capacity over six years. The sequence is: 2020 41.0%; 2021 42.6%; 2022 44.2%; 2023 45.8%; 2024 47.4%; 2025 49.0%; and 2026 50.6%.
6 See the latest report from Wood Mackenzie, Tectonic Shift: China’s world-changing push for energy independence, 2021, at: Tectonic shift: China’s world-changing push for energy independence | Wood Mackenzie
7 See “2021 National Coal Trade Fair: How to make a steady start?” 24 January 2021.
8 Note that nuclear added a further 1 GW capacity in 2020, making 135 GW non-fossil fuel capacity (WWS + nuclear). Nuclear now accounts for only marginal increases.
9 See “China’s new 2030 climate commitments: Beyond peak emissions”, HIS Markit, 15 Dec 2020.
10 See “2021 National Coal Trade Fair: How to make a steady start?” 24 January 2021.
11 See “Total energy consumption in 2020 about 4.97 billion tons of standard coal and task of total energy consumption control completed”, 25 January 2021.
12 Another indication is “Access to electricity (% of population)”. According to the data of World Bank, Japan, US and EU-28 had all achieved 100% by 2000. China caught up from 96.91% in 2000 to 100% by 2013.
13 The IEA report, to be titled The role of critical minerals in clean energy transitions, is due to be published in May 2021 (DeWit 2021).
14 See the Commentary by Mathews and Tan in Nature in 2016 on this theme. For a review of the rising significance of “urban mining” (recovering strategic materials like copper from material flows), see the recent report from the Fraunhofer Institute in Karlsruhe, Germany, The promise and limits of Urban Mining, Nov 2020 . On the rising levels of recovery of critical raw materials from green technologies, see Charles et al (2020).
15 See the argument on this point in the Commentary published in Nature (Mathews and Tan 2014).